| Break Even Chart | |||||||
| Multi Product | |||||||
| Weighted Contribution Method | |||||||
| Break Even Table | |||||||
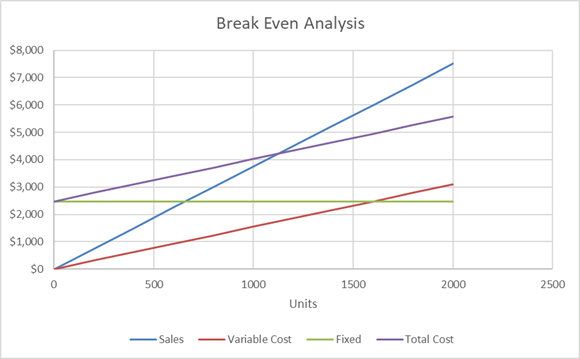
| Units Start | Units Increment | Unit Price | Unit Variable Cost | Total Fixed Cost | |||
| 0 | 200 | $3.75 | $1.55 | $2,475.00 | |||
| Contribution | |||||||
| Units | Sales | Variable Cost | Margin | Fixed | Total Cost | Net Income | |
| 0 | $0 | $0 | $0 | $2,475 | $2,475 | -$2,475 | |
| 200 | $750 | $310 | $440 | $2,475 | $2,785 | -$2,035 | |
| 400 | $1,500 | $620 | $880 | $2,475 | $3,095 | -$1,595 | |
| 600 | $2,250 | $930 | $1,320 | $2,475 | $3,405 | -$1,155 | |
| 800 | $3,000 | $1,240 | $1,760 | $2,475 | $3,715 | -$715 | |
| 1000 | $3,750 | $1,550 | $2,200 | $2,475 | $4,025 | -$275 | |
| 1200 | $4,500 | $1,860 | $2,640 | $2,475 | $4,335 | $165 | |
| 1400 | $5,250 | $2,170 | $3,080 | $2,475 | $4,645 | $605 | |
| 1600 | $6,000 | $2,480 | $3,520 | $2,475 | $4,955 | $1,045 | |
| 1800 | $6,750 | $2,790 | $3,960 | $2,475 | $5,265 | $1,485 | |
| 2000 | $7,500 | $3,100 | $4,400 | $2,475 | $5,575 | $1,925 | |
|
|
|||||||